Data that describes your factory

Most plant reporting describes an average factory: one OEE for the month, one energy figure for the site. We join machine, MES and ERP data so the numbers describe yours, at the line, the batch and the shift.

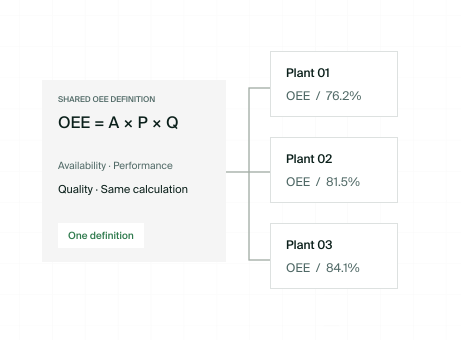
One OEE, comparable across plants

Plants may calculate availability, performance, and quality differently, making OEE comparisons misleading unless the definitions and operating context are aligned.
SOLUTION:
Establish a single definition in the data layer while keeping individual plant exceptions visible rather than hidden.
RESULT:
Clean, reliable metrics per line and per plant that operations can actually trust and compare.
Downtime with a cause you can trust

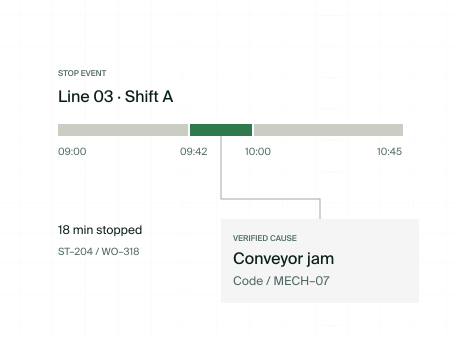
Stops are logged as free text or generic default codes, leaving "Other" as the largest bucket of downtime.
SOLUTION:
Link line-stop events with maintenance orders and agreed reason codes, flagging missing or conflicting classifications for review
RESULT:
Precise downtime tied to a root cause, line, and shift—providing the exact data machine learning models need to learn from.

Real-time analytics that reach the maintenance plan

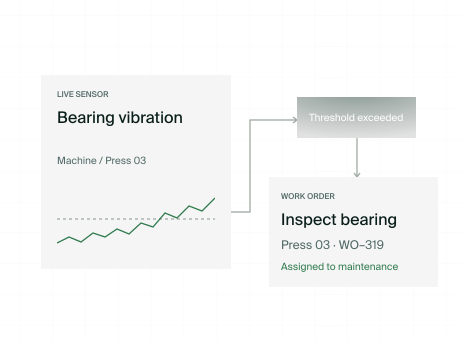
IoT data streams into a standalone dashboard while the maintenance schedule lives in a separate spreadsheet, and the two never intersect.
SOLUTION:
Connect streaming equipment data to agreed detection rules or existing models, and route actionable signals into the maintenance workflow.
RESULT:
Maintenance teams receive timely signals with equipment context and a clear next action, so emerging issues can be investigated before they lead to unplanned downtime.

Energy and emissions per unit, not per plant

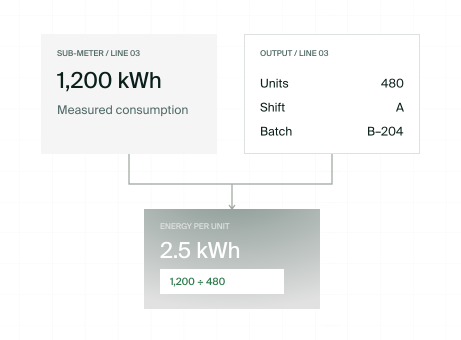
Utility meters measure at the facility level while production is tracked by the line, making energy-per-unit metrics little more than a guess.
SOLUTION:
Align available meter readings with production orders and time windows. Document the allocation rules and emission factors used where direct measurement is not available.
RESULT:
Traceable energy use and estimated associated emissions per unit, line, or shift, with measured values clearly separated from allocations and assumptions.

Trace a defect back through its production history

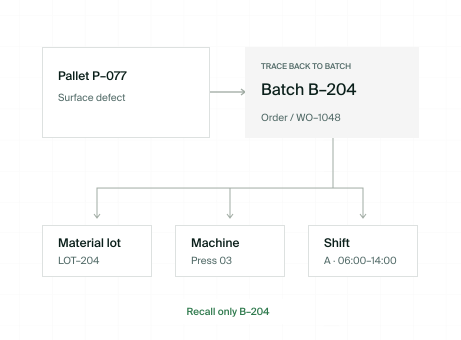
A customer complaint arrives, but nobody can link the pallet to a specific material lot, machine, or shift, forcing recalls to be handled by guesswork.
SOLUTION:
Build end-to-end genealogy connecting material lots to machines, orders, and pallets, keeping the data actively queryable instead of archived.
RESULT:
Trace affected products to the linked material lots, machines, orders, and pallets, helping quality teams define the scope of an investigation or recall.