From SCADA to Asset-Level Profitability
How energy companies connect SCADA, maintenance, metering and financial data to measure asset-level losses and improve operational decisions.


Why energy operators can measure pretty much everything about their assets except the financial cost of underperformance.
An energy operator can tell you when a turbine has stopped, how much power a solar farm has produced, whether a battery has responded to a dispatch etc.
But ask a different question: how much money did that operational event actually cost? and the answer often becomes much harder to produce.
The problem is almost never a lack of data.
SCADA systems take the equipment telemetry. The historians hold the operational signals. The maintenance platforms have the intervention records. The metering systems have the energy delivered. The trading and ERP systems have the prices, the contracts and the transactions.
What's often missing is the link between these systems.
The most important data problem in energy operations isn't necessarily about working out what actually happened. It's about working out what that event cost, why it happened and whether the loss was avoidable.
A turbine stopped. What did it actually cost?
Imagine a wind farm operator with 80 turbines spread across a number of sites.
At 10.00am one turbine develops a technical fault and is offline for two hours.
The ops system has logged the event. Maintenance have had an alert. The asset management dashboard shows 2 hours of downtime.
But what was the financial impact?
A simple calculation would be to take the turbine's rated capacity, multiply it by the duration of the outage and then by the average electricity price.
That would be misleading.
Rated capacity is not the same as expected generation. Wind conditions will vary. Electricity prices will vary throughout the day. The asset may have been subject to curtailment. Contractual arrangements may mean that lost generation doesn't necessarily equate to lost revenue.
To estimate the financial impact reliably, the operator needs to connect several independent datasets:
- SCADA telemetry: actual production, turbine status, wind conditions and fault events.
- Expected production: A validated performance model taking into account the available wind resource and operating conditions.
- Market and contractual data: relevant electricity prices, hedging and power purchase agreements.
- Curtailment and dispatch: whether the asset was allowed to generate at the expected level.
- Maintenance records: failure classification, when the intervention takes place and who is responsible for the outage.
- Metering and settlement records: energy delivered, measurement boundaries and financial settlement.
Each dataset answers part of the question. None of them answers it in isolation.
That's where a well designed operational data model comes in.
What €850 of apparent lost revenue can tell us and what it cannot
Consider a simple two hour outage.
Illustrative financial impact of a turbine outage
Expected generation during outage: 10 MWh
Actual generation: 0 MWh
Assumed realized energy price: €85/MWh
Apparent lost energy revenue: €850
Illustrative calculation: 10 MWh × €85/MWh = €850. Actual financial impact depends on contractual arrangements, curtailment, settlement rules and other factors.
The first estimate is straightforward:
10 MWh × €85/MWh = €850
But that's only the beginning.
If some of the expected generation had been curtailed then those MWh should not be automatically classed as lost generation as a result of the failure.
If the operator is selling electricity under a fixed price PPA the relevant economic value will be different to the spot price.
If the Lost Generation has any impact on the balancing obligations or the availability guarantees then there could be additional costs or contractual consequences.
Maintenance expenditure, warranty recoveries and potential insurance recoveries all add further financial dimensions.
Even the 'expected generation' figure has to be treated with care as it's an estimate from a performance model rather than an absolute fact.
The aim is not to assign a market price to every missing MWh. The aim is to produce a defensible financial explanation of an operational event.
The €850 example is entirely hypothetical and is not a real Cadvel client result.
The missing layer between operational systems and financial reporting
Lots of energy companies already have the technology in place to collect, store and visualise their data.
The gap typically arises when the operational and financial systems need to reach agreement on the same event.
A maintenance system will identify a turbine via its internal equipment code. SCADA will use a control system identifier. The asset register will have its own naming convention. The commercial system may group a number of turbines into a single settlement unit.
Even if the systems record the same physical asset they may well have a different definition of that asset.
Time creates another complication.
A sensor reports every few seconds. The historian has the aggregated readings. The market system uses settlement intervals. The ERP system has transactions by accounting period.
Joining these datasets isn't just a case of matching on timestamps.
The data architecture requires a consistent model of assets, events, measurement intervals, commercial arrangements and financial outcomes.
In practical terms, that means establishing:
A single asset identity. Every operational event, every meter reading, every maintenance record and every commercial agreement must be linked to the correct physical or commercial asset.
A consistent time model. Event times, measurement periods, market periods and settlement periods all need to be aligned in time without loss of the original granularity.
Clear definitions of losses. Mechanical unavailability, grid constraints, planned outages, curtailment and performance degradation are all different causes and will have different financial implications.
Traceable calculations. Every financial estimate should be traceable from the underlying measurements, assumptions, rules and data versions.
Explicit data quality controls. Missing signals, sensor faults, late arriving measurements and inconsistent equipment IDs must be picked up prior to them having any impact on the financials.
Without those foundations in place, even a very sophisticated dashboard might just end up showing two very different interpretations of the same operation.
From SCADA events to a financial impact model
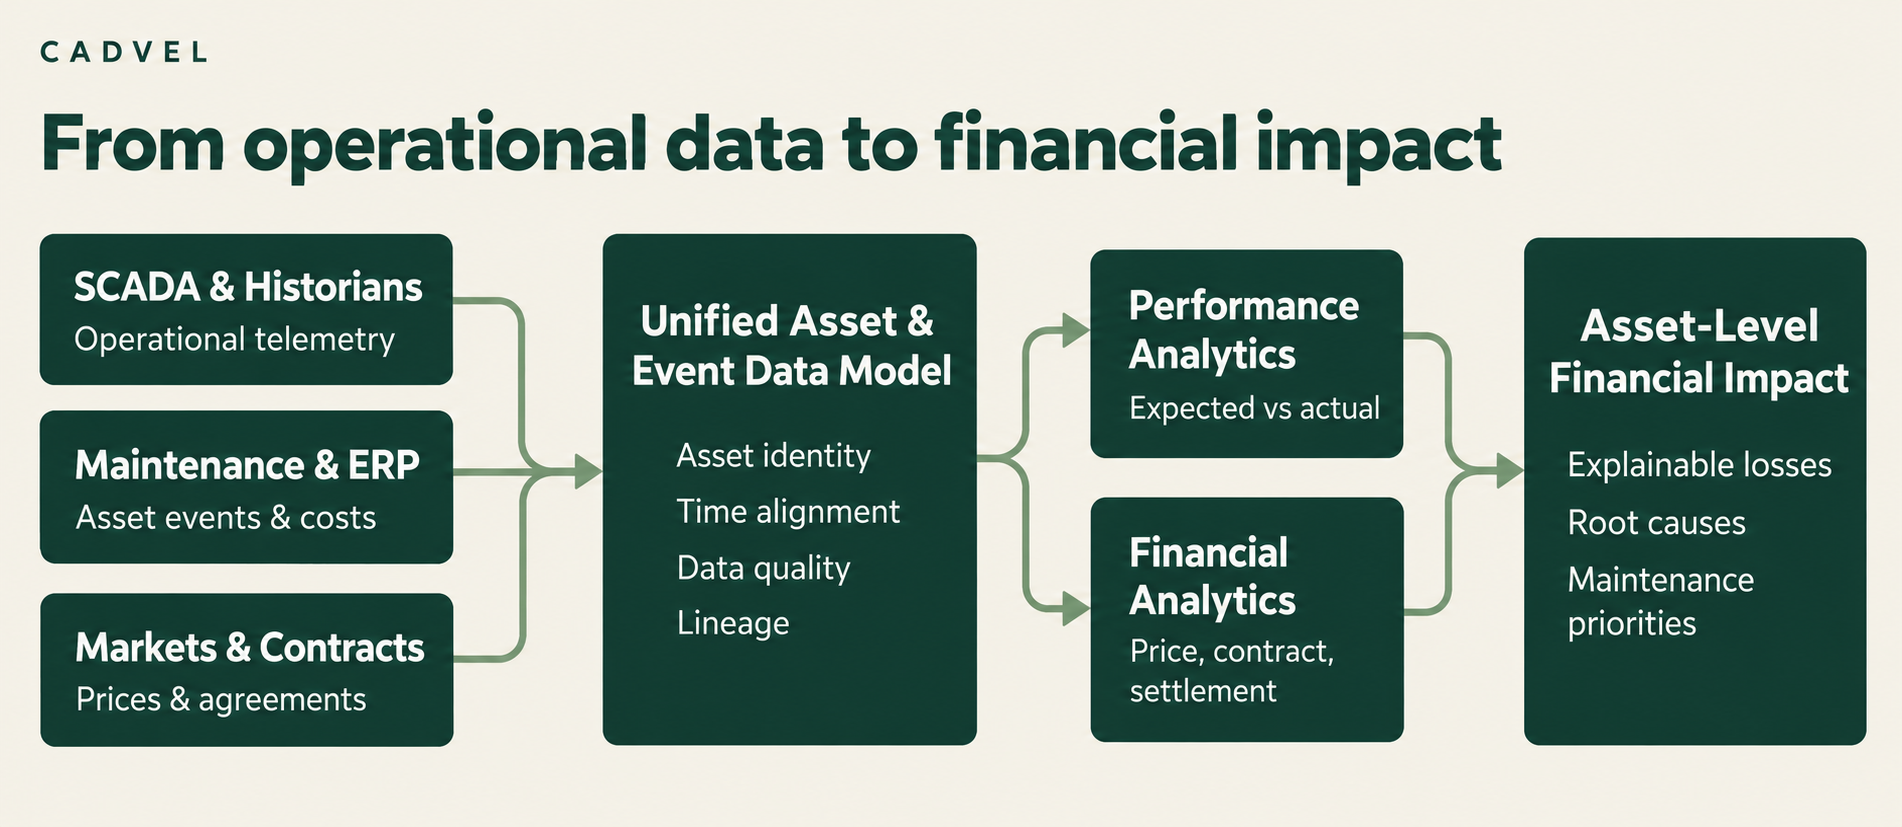
A good architecture doesn't necessarily have to replace the operational systems that are already there.
Instead it creates a governed analytical layer which connects them.
The process can be broken down into four stages.
1. Preserve operational context
SCADA events and historian measurements are all ingested with their source timestamps, asset IDs, quality flags and operating states.
Where appropriate high frequency data can be stored separately from the financial and business records, preserving the detail without the need for every reporting workload to go and scan the raw telemetry.
2. Establish expected versus actual performance
A validated performance model gives an estimate of what the asset could have reasonably generated under the observed circumstances.
The system then splits potential energy generation from actual energy delivered, taking into account availability, constraints, curtailment and all the other relevant operating states.
This difference is important because not every difference between potential and actual output is indicative of a piece of equipment having failed.
3. Connect operational differences to commercial exposure
Operational losses are assessed against the relevant price curves, contracts, dispatch obligations, settlement rules and other commercial terms.
The calculation should where possible separate out the estimated revenue exposure, the actual financial loss and the additional operating costs.
4. Make the result explainable
An asset manager should be able to open a financial loss estimate and see the event, the affected intervals, the expected-versus-actual production, the pricing basis, and the assumptions used.
The result is not simply another KPI.
It's a traceable explanation of an operational event leading to a financial outcome.
Where ClickHouse, Snowflake, and streaming technologies fit
Different parts of this problem have different requirements of the data infrastructure.
High frequency operational telemetry is all about massive volumes of time series records and associated analytical queries across assets and time periods.
Platforms like ClickHouse can be appropriate for workloads that involve time series storage, aggregation and interactive exploration.
Snowflake is the right platform to bring operational data (e.g. KPIs) into the financial, contractual, maintenance and enterprise reporting data sets, especially where you have a need for governed access and cross-functional analysis.
Streaming technologies such as Kafka can support event ingestion where the operational latency requirements are such that continuous processing is acceptable.
But none of those technologies in themselves solve the fundamental business issue.
A fast time series database doesn't tell you which contract is on a turbine. A cloud data warehouse doesn't tell you whether a turbine has been curtailed or whether it's just failed. A streaming pipeline doesn't guarantee that the financial calculations you're doing are in any way trustworthy.
Technology selection should be driven by the data volumes, the latency requirements, the existing architecture and the actual business questions you're trying to answer. It shouldn't be the other way around.
For some operators the value to be gained from improving the existing data model and reconciliation processes may be greater than the value of introducing another platform.
Five questions energy operators should be able to answer
A connected operational and financial data foundation should make questions like these easier to investigate:
- Which assets caused the biggest avoidable financial loss last month? Not just which assets had the most downtime.
- Which equipment failures are the most costly in terms of economics? That would be the ones that occur most frequently combined with lost production, length of repair and financial exposure.
- Where measured energy differs from the operational production records. Spotting the measurement discrepancies, the electrical losses and the reconciliation issues.
- How much do delayed interventions cost? What's the financial impact of the time between fault detection, diagnosis and resolution?
- Which assets should we look at first? Prioritising our maintenance and performance investigations by expected economic value rather than by alarm volume.
These questions are relevant in respect of wind generation.
Solar portfolio operators, battery storage operators, distributed energy resources and utilities all face the same set of issues in some form or another. The operational constraints and the commercial calculations are of course all different.
The common requirement is a reliable link between the physical operations and the business outcomes.
Measure the loss before investing in another platform
The first step shouldn't be a big transformation programme.
Start with one site, one asset class or one category of recurring operational loss.
Pick a representative period and see whether the operational events can be squared with the expected production, the metering records and the relevant commercial data.
Measure what is still unknown: the proportion of losses which are unexplained, the amount of effort which goes into reconciling systems, the quality of the financial estimates and the number of decisions which are simply put off because of the lack of information.
Then work out whether the root problem is one of data modelling, integration, observability, performance or indeed new infrastructure.
This is how Cadvel does data engineering. You start with the actual cost of the problem (in terms of money, time etc). Then you define the smallest intervention that is technically feasible to solve it.
The aim is not to produce a more impressive dashboard.
It's about making operational performance financially explainable at the level where the decisions are actually being made.
Technical References & Further Reading
The concepts discussed in this article build on established approaches to wind energy performance assessment, operational loss classification, and energy data analysis.
1. National Renewable Energy Laboratory (NREL) — Wind Plant Performance Prediction
Technical research covering approaches to wind plant performance evaluation and energy production analysis.
https://docs.nrel.gov/docs/fy22osti/78715.pdf
2. System Advisor Model (SAM) — Wind Power Losses
Documentation describing wind energy loss categories, including availability, electrical losses, and performance-related factors.
https://samrepo.nlr.gov/help/wind_losses.html
3. Wind Energy — Analysis of Energy Yield Estimation
Research relevant to wind energy yield estimation and the interpretation of operational and metering data.
https://onlinelibrary.wiley.com/doi/10.1002/we.2768
These references provide technical background. The asset-level financial calculation in this article is an illustrative example developed by Cadvel, not a reported result from these publications.
Can you tell us what your operational losses have cost?
If your SCADA, maintenance, metering and financial systems are producing different versions of asset performance then the first step is to quantify the gap.
Cadvel helps energy companies connect operational and business data, establish traceable metrics, and identify the infrastructure changes needed to support reliable decisions.
Explore Cadvel’s Energy & EV capabilities
Measure the problem before funding the solution.