Datadog for data platform observability
Datadog gives data teams a shared view of pipeline jobs, data-quality signals, and the infrastructure they depend on. With the right integrations and monitors, failed or delayed jobs, stale data, and other operational issues become visible before they affect dashboards or downstream applications.


What it is good at
Shared visibility across infrastructure, pipeline execution, and data-health signals

Telemetry filtering, sampling, retention, and aggregation designed around operational needs
Monitors, dashboards, and alert-routing rules managed as code
Tracing and diagnostics across pipelines and services
What we deliver with Datadog

Pipeline and job monitoring
We monitor the jobs the business depends on: orchestration runs, transformation models, loads, and exports. We define what counts as a failure, what counts as too late, and who is notified in each case.

Data freshness, latency, and availability
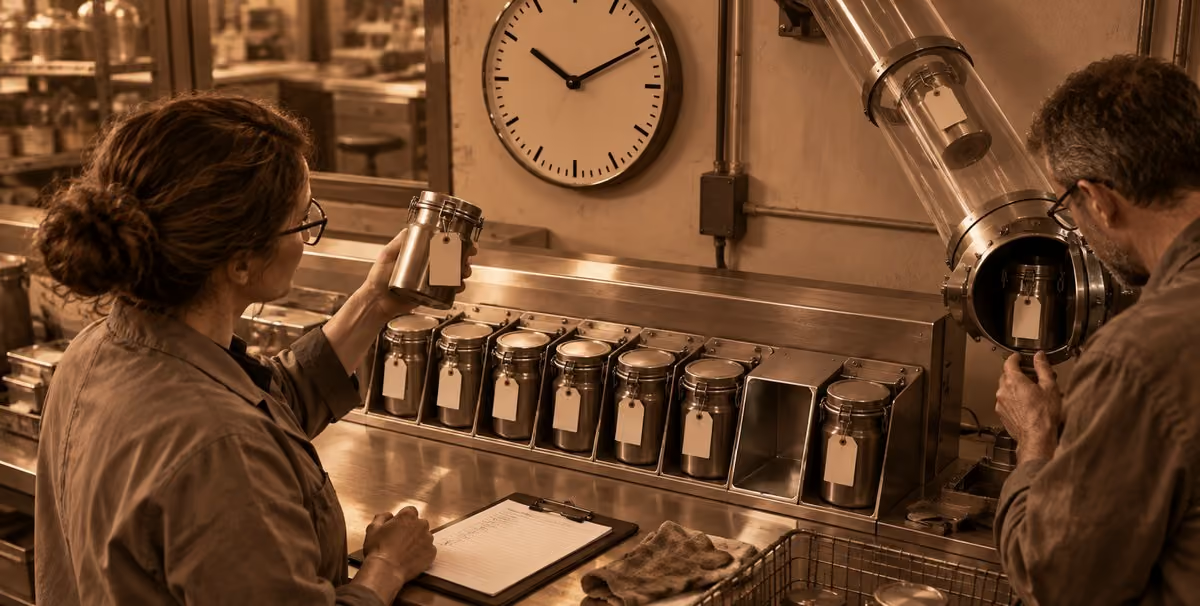
A pipeline can finish without error and still deliver stale or incomplete data. We monitor freshness, row volumes, and expected arrival windows for critical datasets, so a silent gap becomes an alert instead of a reporting problem discovered later.
Data-quality signals next to service health
We instrument data-quality checks and publish their results as metrics and monitors in the same place as infrastructure and service health. The result is a single view: when a number in a report looks wrong, the dataset, the pipeline, and the infrastructure it ran on are visible together.
Dashboards and operational views
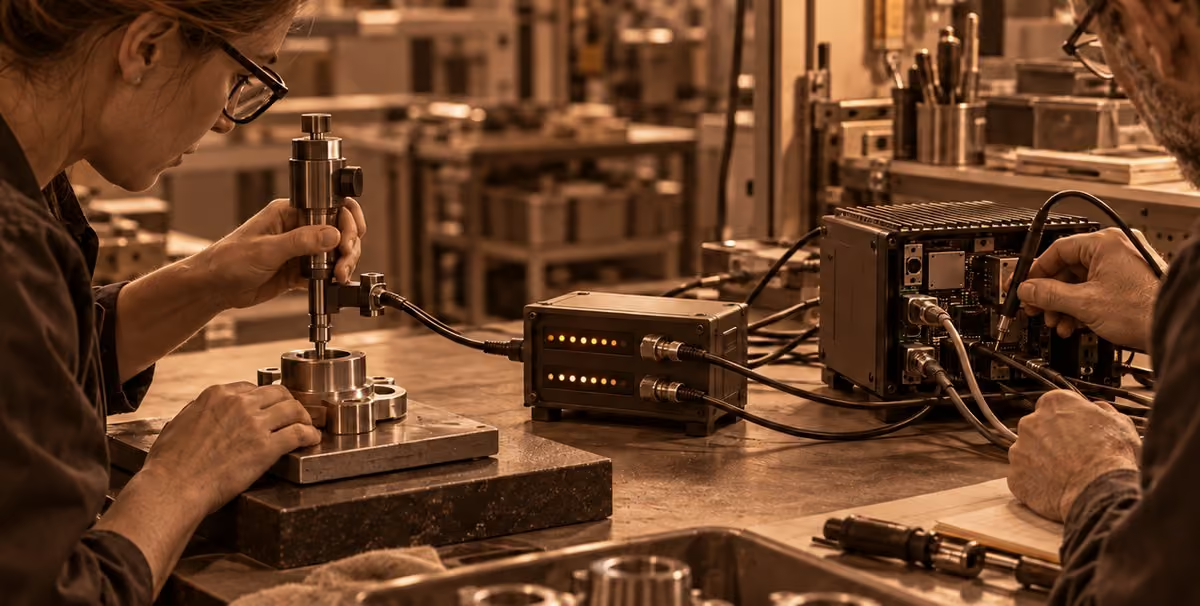
We build dashboards for the people who use them: an on-call view for incidents, an owner view per data domain, and a platform view for capacity and cost. Each view answers a defined question. Dashboards that answer none are removed.

Alert routing and escalation
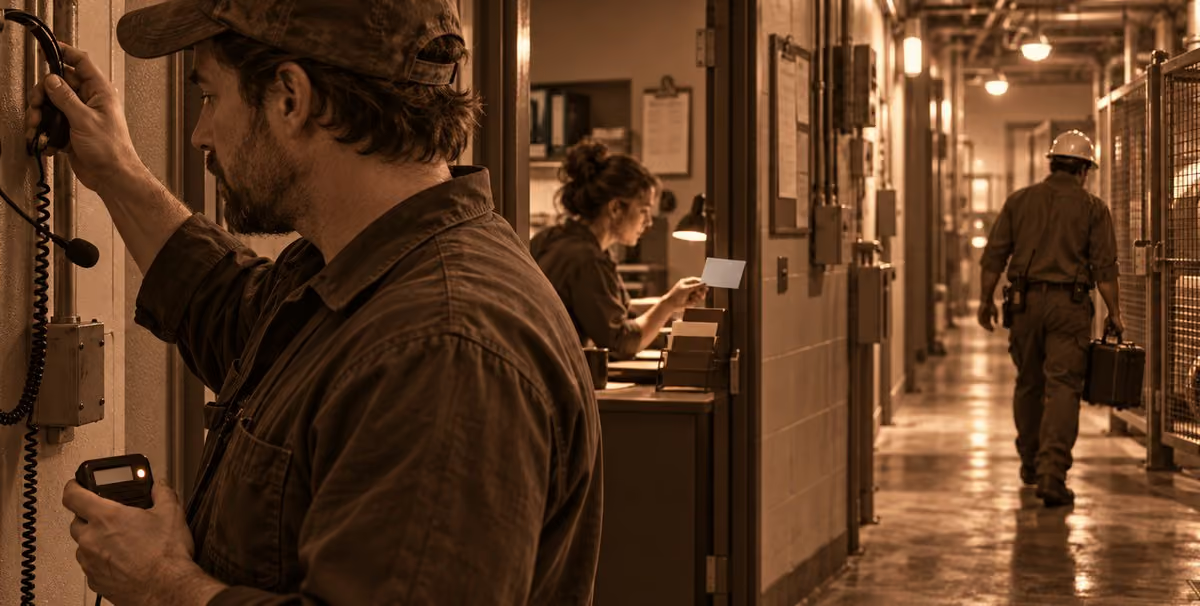
An alert without a clear owner is noise, and noise is the reason on-call rotations stop reacting. We map monitors to owners, severity levels, notification channels, and escalation paths, then tune thresholds so the alerts stay credible.
Instrumentation: logs, metrics, and traces
We instrument pipelines and services so a failure can be followed from the report back to the job, the query, and the infrastructure underneath. We standardize tagging, naming, and service ownership, because that is what makes the telemetry usable months later.

Cost control in Datadog
Telemetry volume can make Datadog expensive if left unmanaged. We control costs through filtering, retention, metric cardinality, and usage monitoring. At higher volumes, we can keep Datadog as the operational layer and use ClickHouse for high-volume, long-term analysis.
Monitors and alerting rules managed as code
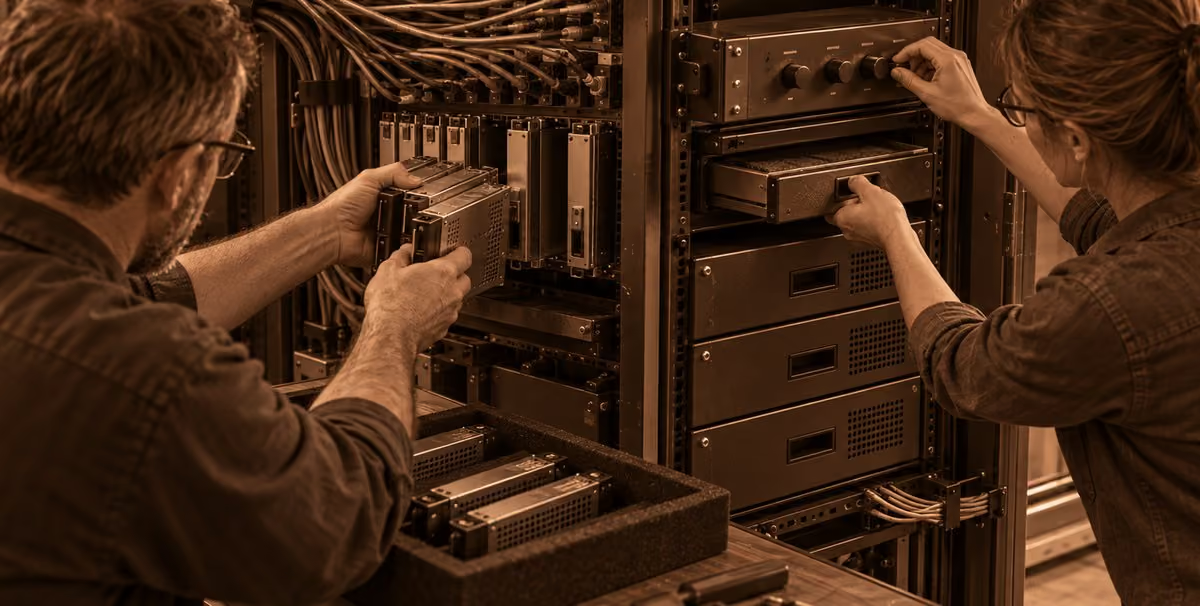
Monitors, dashboards, alerting rules, and their ownership live in a repository and are deployed through your pipeline rather than assembled by hand in the interface. Changes are reviewable, reproducible across environments, and they survive changes in the team.


Cadvel is a Datadog Technology Partner
Partnership status
